May 08, 2011
I was lucky enough to receive the awesome gift of a Garmin Forerunner 305 GPS watch recently, and it quickly became an essential piece of running gear. It collects all sorts of fun data from each workout, but my favorite feature is the heartrate monitor, which wirelessly transmits heartrate information to the watch from an elastic band worn on the torso. Having such objective feedback about how hard the heart is working can be very useful info mid-run, but why limit the Garmin 305 to my runs?
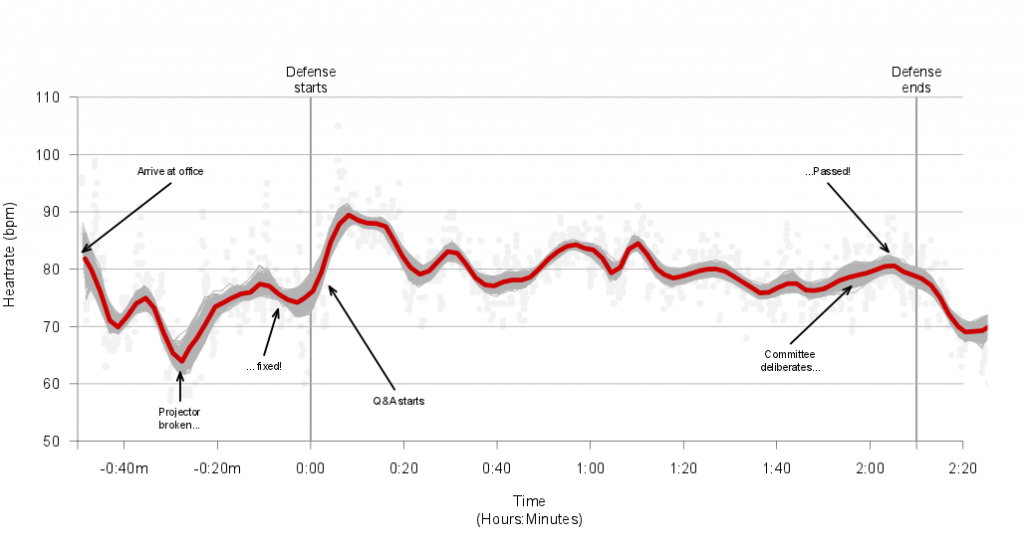
I’ve been wanting to play around with the Garmin data in R anyway, so for a fun project, I tracked my heartrate during my oral defense of my dissertation last week. I started tracking about 50 minutes before the defense started and ended shortly after the defense, which lasted a little over two hours. The Garmin 305 saves all workout data as .tcx files, and I used the free software TCX Converter to convert my “workout” file to a .csv.
From there, it was pretty straightforward to plot everything out (I used functions from Hadley Wickham’s stringr package and a smoother from Frank Harrell’s Hmisc package; R code below). Everything went pretty smoothly during the defense (the proposal is generally much tougher, I’m told), and it looks like I calmed down and settled in after the 25 minutes or so. (My resting heartrate is just under 60 bpm.)
Perhaps the most stressful part of the whole process was getting the projector to cooperate with my poor old work laptop for the 20 minutes prior to the presentation. Subjectively, I felt relatively calm during while talking, but I was surprised to see such a drop in my heartrate directly after it was finished.
I really wish I had this kind of data for all my past talks and presentations, because I’m sure my heartrate was skyrocketing during these kind of things five years ago. Training works!
library(stringr)
library(Hmisc)

defense <- read.table("defense.csv", header=T, sep=",")

## Time is in a big string, so str_sub from the stringr library
## pulls out hours, minutes, and seconds
defense$hour <- as.numeric(str_sub(defense$TIME, start=12, end=13))
defense$minute <- as.numeric(str_sub(defense$TIME, start=15, end=16))
defense$second <- as.numeric(str_sub(defense$TIME, start=18, end=19))

## Combine three time variables to create a "total minutes passed" variable
## Time started in the 17:00 hour
defense$totalminutes <- (defense$hour - 17)*60 + defense$minute + defense$second/60

par(mar=c(5,4,3,2))
plot(defense$totalminutes, defense$HR, pch=16, col="grey95", axes=F,
  ylim=c(50,115), xlim=c(20, 202), ylab="Heartrate (bpm)", xlab="Time\n(Hours:Minutes)")

# Create custom axes, labels and tickmarks
x.axis.ticks <- c(14, 24, 44, 64, 84, 104, 124, 144, 164, 184, 194, 204)
x.axis.labels <- c(" ", "-0:40m", "-0:20m", "0:00", "0:20","0:40","1:00","1:20",
                 "1:40", "2:00", " ", "2:20")
y.axis.ticks <- c(50, 60, 70, 80, 90, 100, 110)
y.axis.labels <- c(50, 60, 70, 80, 90, 100, 110)
axis(side=2, pos=14, las=2,lty=1, lwd=.5, at=y.axis.ticks,
   labels=y.axis.labels, tck=-.02, cex.axis=1.0)
axis(side=1, pos=50, las=0,lty=1, lwd=.5, at=x.axis.ticks,
   labels=x.axis.labels, tck=-.02, cex.axis=1.0)

# Two vertical gridlines with labels
segments(x0=64, x1=64, y0=50, y1=110, lwd=2, col="grey60", lty=1)
text(x=64, y=113, "Defense\nstarts", cex=.9)
segments(x0=194, x1=194, y0=50, y1=110, lwd=2, col="grey60", lty=1)
text(x=194, y=113, "Defense\nends", cex=.9)

# Create horizontal gridlines
for (i in seq(60,110,10))
{
  segments(x0=14, x1=204, y0=i, y1=i, lwd=1, col="grey70", lty=1)
}

# Just for fun, bootstrap a loess smoother (using plsmo() from Hmisc library)
for (i in 1:1000)
{
  myboot <- sample(1:nrow(defense), replace=TRUE)
  bootdata <- defense[myboot,]
  plsmo(bootdata$totalminutes, bootdata$HR, col="grey70", f=.05, add=TRUE)
}

# Draw one overlapping thick red smoothed line
plsmo(x=defense$totalminutes, y=defense$HR, col="red3",lty=1,
      lwd=5, f=.05, add=TRUE, datadensity=F)

# Label various events

arrows(x0=34, y0=95, x1=15, y1=83, lwd=2, angle=20, length=.1)
text(x=34, y=97, "Arrive at office", cex=.7)

arrows(x0=36, y0=57, x1=36, y1=62, lwd=2, angle=20, length=.1)
text(x=36, y=54, "Projector\nbroken...", cex=.7]